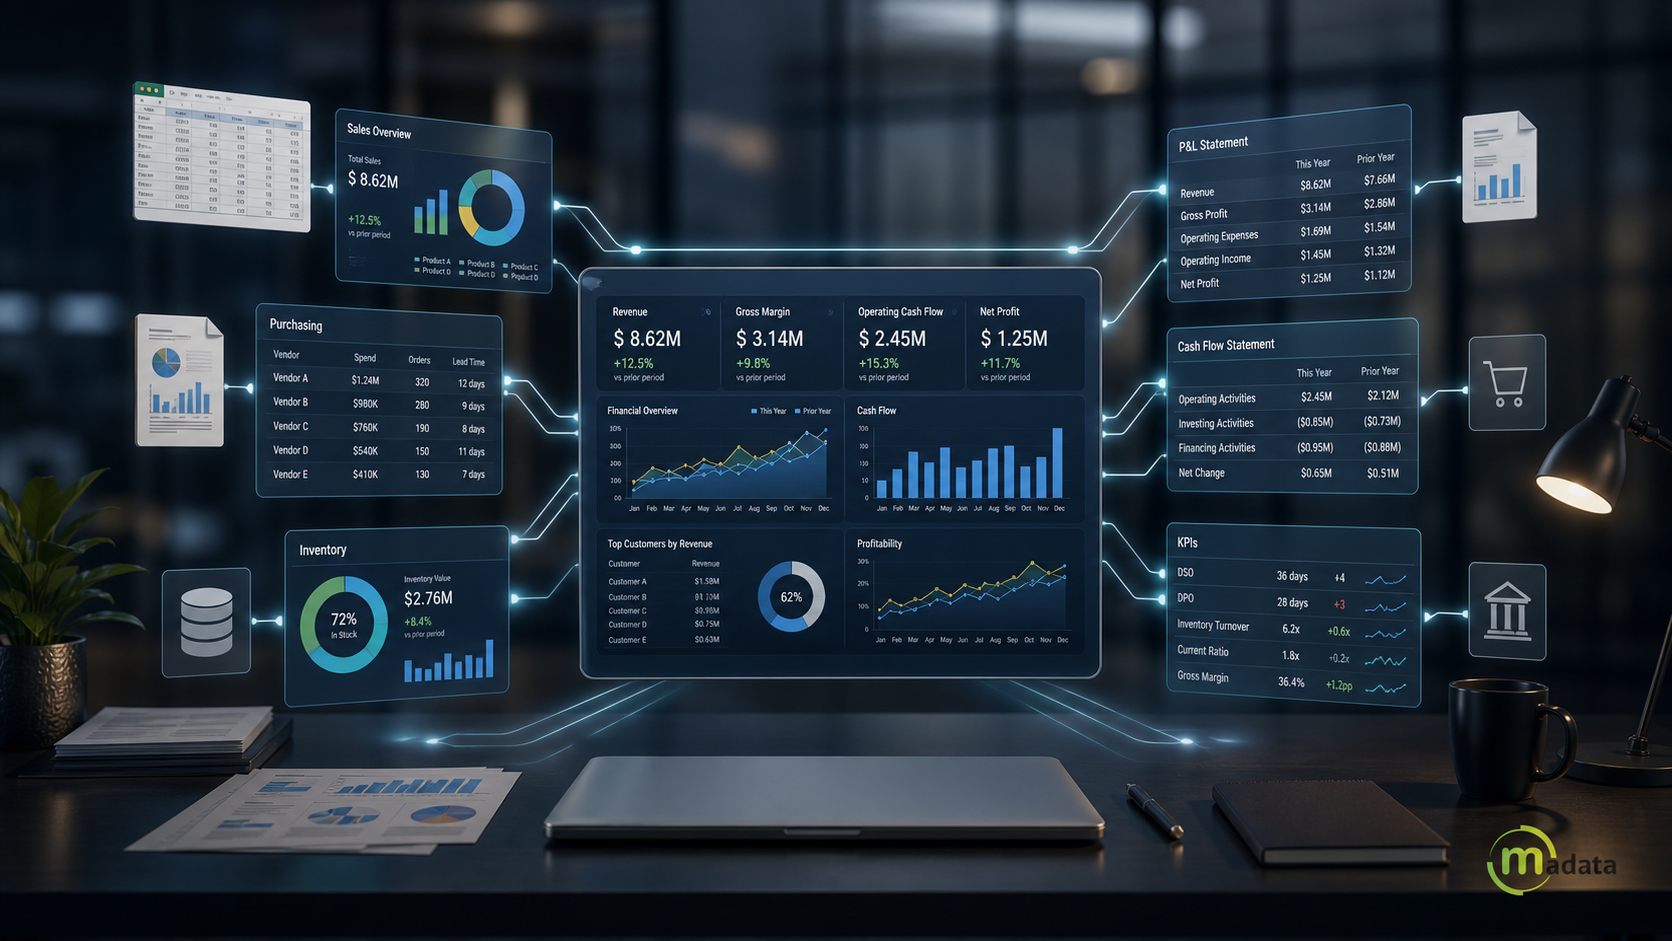

Every month, the finance teams at many companies go through the same process: they check various systems, reconcile figures in spreadsheets, correct discrepancies, and prepare reports that reach management days late.
The cost goes beyond the time spent. When there are different versions of the same figure, it becomes difficult to answer essential questions: How much did we actually sell? What margin did we generate? What is our cash position?
Unifying financial data means establishing shared definitions, sources, and controls so that every metric is consistent and verifiable. To achieve this, the company needs to organize both the information and the processes that generate it.Fragmented Financial Data: A Measurable Problem
The “Future of Finance 2026”report , commissioned by Intuit, is based on a survey conducted in May 2026 of 2,000 CFOs, controllers, and vice presidents of finance at U.S. companies with annual revenue of at least $2.5 million.
Among its findings:
- 70% reported that their critical data was scattered, with no single source of reliable information.
- 51% of the finance department’s weekly time was spent on manual tasks, such as reconciliations, data exports, corrections, and report generation.
- 57% reported having missed a strategic opportunity in the previous six months because financial information arrived late.
- Only 14% had same-day data available for their most recent major decision.
Source: Intuit, Future of Finance 2026: Results and Methodology.
These figures correspond to the U.S. sample; they do not represent measurements for Mexico or Latin America. For companies in the region, they offer a benchmark for assessing the amount of manual work and delays in their own processes.
Why don’t the reports from Finance, Sales, and Operations match up?
The differences aren’t always errors. Often, each department measures a different point in the operation.
Sales may report confirmed orders; Operations, completed deliveries; and Finance, revenue recognized for accounting purposes.
All three figures may be correct, but they do not represent the same thing.
The problem arises when they are all presented under the same heading: “monthly sales.”
If, on top of that, each department maintains its own records, applies different filters, or retrieves the information on different dates, explaining the variations becomes a recurring task.
Before creating another report, it’s a good idea to determine what each metric measures, where the data comes from, and when it’s updated.
What is a single source of financial data?
A single source of financial data is a framework in which each metric has an agreed-upon definition, an authorized source, and a person responsible for its quality.
This allows departments to access consistent information, and any discrepancies can be explained through documented rules.
A company can operate using an ERP, a CRM, and a payroll system, provided there are clear criteria for integrating and reconciling their data.
Three conditions are necessary to build this foundation:
Shared definitions: each department understands the same meaning for revenue, margin, portfolio, or cash position.
Traceability: It is possible to identify the records and criteria that led to a specific figure.
Reconciliation: Discrepancies between sources are reviewed, explained, and resolved through an established process.
A dashboard makes it easier to view data, but its usefulness depends on the quality of the data that feeds it.
Five Steps to Building Reliable Financial Information
The starting point can be straightforward: choose the metrics that management uses most frequently and ensure their consistency before expanding the effort.
1. Identify the business’s key metrics
Select five metrics that influence the company’s decisions.
For example:
- Revenue for the period.
- Gross margin.
- Operating income.
- Cash position.
- Past-due portfolio.
The selection should be based on the business’s needs. A retail company may need to pay special attention to inventory, while a service company may prioritize profitability per project.
2. Document how each metric is calculated
For each figure, define the formula, the source system, the cutoff date, any exclusions, and the person responsible for validating it.
For example, a sales report should clarify whether it includes taxes, how it handles cancellations and returns, and what date it uses to assign transactions to a specific period.
These rules allow results to be compared using the same criteria.
3. Identify the reports where each figure appears
Identify where each indicator appears: management reports, dashboards, departmental files, or documents for senior management.
Then, compare the results using the same time period and scope.
This exercise helps identify discrepancies caused by filters, manual data entry, or outdated versions.
4. Establish the authoritative source and explain the differences
Determine which source will be used as a reference for each indicator and align the corresponding reports.
Legitimate differences must be accompanied by an explanation.
An orders report and a revenue report may show different amounts; their names and definitions should make it clear why.
The goal is for every figure to have a clear meaning and a verifiable source.
5. Maintain a review schedule
Define when the metrics will be reviewed, who will validate the reconciliations, and how outstanding discrepancies will be followed up on.
Once the first five figures have stabilized, add new metrics.
In this way, financial data governance becomes a daily practice with clear responsibilities and deliverables.
How do you measure progress?
To assess improvement, it’s important to look at both the consistency of the data and the effort required to produce it.
Accounting close time.
How many days elapse between the end of the period and the availability of audited reports?
Reconciliations completed on time.
What percentage of reviews are completed within the agreed-upon timeframe.
Unexplained differences.
How many discrepancies remain unresolved between reports that should show the same result.
Time spent preparing and analyzing information.
How many hours are spent entering, correcting, and consolidating data, and how many on interpreting the results?
For example, if a company completes 16 out of 20 scheduled reconciliations on time, its compliance rate is 80%.
This illustrative calculation helps establish a baseline and track monthly progress; it does not represent an industry average.
The key is to measure using consistent criteria and ensure that increased speed does not compromise the quality of the review.
When is it a good idea to review the company’s management system?
If the team needs to export, copy, and correct information every time it prepares a report, it’s worth reviewing how the business processes are interconnected.
Some signs include:
- Sales, purchases, and inventory are recorded in disconnected systems.
- The same transaction is entered multiple times.
- Reports rely on files that only one person knows how to update.
- It is difficult to link a financial figure to the transaction that generated it.
- As the company grows, the amount of manual consolidation work increases.
In these cases, in addition to documenting rules and assigning responsibilities, it is advisable to evaluate an enterprise resource planning (ERP) system that integrates the departments involved.
The evaluation should consider the processes, integrations, and reports the company needs, as well as the controls it must maintain.
How does SAP Business One help integrate business information?
SAP Business One is an ERP system for small and medium-sized businesses that integrates finance, accounting, purchasing, inventory, sales, and customer relations, in addition to offering analytics and reporting tools.
These capabilities allow you to manage key areas from a single solution.
Source: SAP, SAP Business One features.
For a company that works with scattered information, these capabilities can serve as a foundation for integrating financial management with day-to-day operations and reducing reliance on separate files.
Their contribution to the reliability of reports also depends on the implementation: a well-structured chart of accounts, cleaned-up master data, consistent posting criteria, and clearly defined responsibilities.
If the company uses other applications or manages multiple entities, it is necessary to evaluate the corresponding integrations and consolidation requirements.
Centralizing processes is an important step; maintaining reliable information requires ongoing controls.
From scattered reports to an integrated operation with Madata
Building reliable financial information starts with concrete actions: defining key performance indicators, identifying their sources, and maintaining a disciplined reconciliation process.
The next step is to have a platform that supports this way of working.
At Madata, we help companies review their processes and information needs to assess how SAP Business One can support more integrated management.
If your team spends too much time compiling files and explaining discrepancies between reports, we can help you identify which processes should be integrated and what scope of implementation your company needs.
Let’s discuss how SAP Business One can help you integrate finance, sales, purchasing, and inventory and build a more reliable foundation for your business decisions.